How to Set Up Prometheus, InfluxDB, and Grafana for Full-Stack Monitoring with Docker

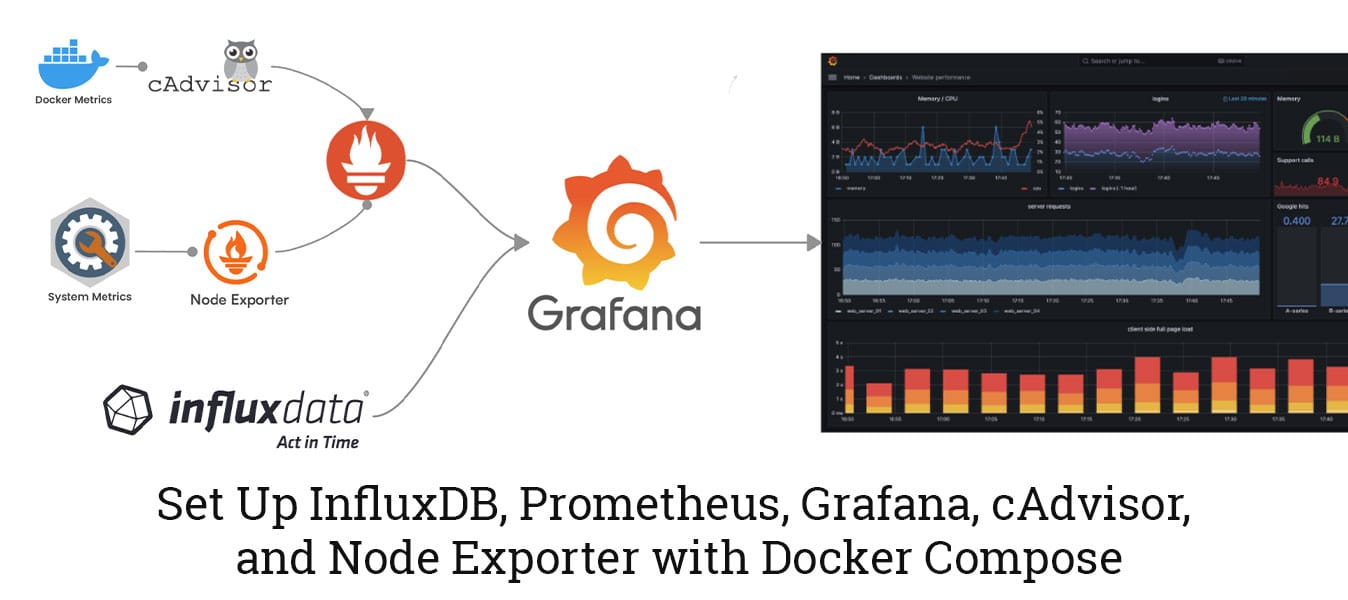
Monitoring your infrastructure is critical to keeping systems healthy, optimizing performance, and planning for growth. In this guide, you’ll learn how to set up a powerful monitoring stack using Prometheus and InfluxDB to collect and store metrics, and Grafana to visualize them.
To demonstrate how data collection works, we’ll use two popular Prometheus exporters: cAdvisor for container metrics and Node Exporter for system-level data. All components will be combined into a single docker-compose.yml file and run using Docker Compose on an Ubuntu server.
🔧 What You’ll Set Up:
- Core Monitoring Stack:
- Prometheus: Collects and stores metrics from various sources.
- InfluxDB: Optional storage for custom or long-term time-series data.
- Grafana: Visualizes metrics from Prometheus and InfluxDB.
- Demonstration Exporters:
- cAdvisor: Provides Docker container metrics to Prometheus.
- Node Exporter: Provides Linux system-level metrics like CPU, memory, and disk usage to Prometheus.
- Service Management:
- Docker Compose: Simplifies running and managing all services.
📂 Project Directory Structure
grafana/
├── data/
│   ├── grafana/
│   ├── influxdb2/
│   │   └── env/
│   └── prometheus/
│       ├── config/
│       │   └── prometheus.yml
│       └── data/
├── docker-compose.yml
📌 Prerequisites
Make sure the following are in place:
- Ubuntu 20.04 or higher
- Docker & Docker Compose installed
sudoprivileges
Step 1: Prepare Directories and Permissions
Let’s create the necessary directories and assign the correct permissions:
sudo mkdir -p grafana/data/grafana grafana/data/prometheus grafana/data/influxdb2 && cd grafana
sudo chown -R 472:472 ./data
📌 Note: UID 472 is the default user Grafana runs as in its container. Assigning this ownership ensures Grafana can write to the volumes.
Step 2: Set Up InfluxDB Admin Credentials
sudo mkdir -p ./data/influxdb2/env && \
sudo bash -c 'echo "Your_InfluxDB_Admin_User" > ./data/influxdb2/env/.env.influxdb2-admin-username' && \
sudo bash -c 'echo "Your_InfluxDB_Admin_Password" > ./data/influxdb2/env/.env.influxdb2-admin-password' && \
sudo bash -c 'echo "MyInitialAdminToken0==" > ./data/influxdb2/env/.env.influxdb2-admin-token'- Replace the placeholders:
Your_InfluxDB_Admin_Username– Replace with your desired InfluxDB admin username.Your_InfluxDB_Admin_Password– Replace with your preferred secure password.MyInitialAdminToken0==– Replace with your custom admin token, or leave it as is if you don’t want to set a specific token.
🔐 Security Tip: Make sure these files are not exposed to the public and are only readable by trusted processes. You can restrict access with:
sudo chmod 600 ./data/influxdb2/env/.env.influxdb2-*Step 3: Configure Prometheus
Create the Prometheus configuration file:
sudo nano ./data/prometheus/config/prometheus.ymlAdd the following content inside prometheus.yml:
global:
  scrape_interval: 15s

scrape_configs:
  - job_name: 'prometheus'
    static_configs:
      - targets: ['localhost:9090']

  - job_name: 'node-exporter'
    static_configs:
      - targets: ['node-exporter:9100']

  - job_name: 'cadvisor'
    static_configs:
      - targets: ['cadvisor:8080']
This configuration tells Prometheus where to scrape metrics from, including itself, Node Exporter, and cAdvisor.